VBA
Code Behind Report
Draw dynamic meters on a report using the Detail_Format event
'*************** Code Start CBR ***********************************************
' Purpose  : code behind a report that calls Draw_Meter_s4p
'              to draw dynamic meters with specified colors
' Author   : crystal (strive4peace)
' Code List: www.msaccessgurus.com/code.htm
' This code: https://msaccessgurus.com/VBA/Draw_Meters.htm
' LICENSE  :
'   You may freely use and share this code, but not sell it.
'   Keep attribution. Mark your changes. Use at your own risk.
'------------------------------------------------------------------------------
'           Detail_Format
'------------------------------------------------------------------------------
Private Sub Detail_Format(Cancel As Integer,FormatCount As Integer)
'221127 crystal
'draw dynamic meters in the detail section of a report
   'CALLs
   '  Draw_Meter_s4p
   'USES
   '  global vriables defined in bas_Draw_Meter_s4p

   Dim dbValue As Double

   'in each case, the dimensions for the meter use a Label control
   'a control makes it easier to visualize
   'but wouldn't be necessary
    '----- 1
   dbValue = Nz(Me.Value1,0)

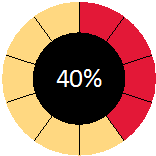
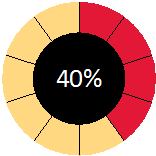
   'black center and tick marks
   'font is 20 points and white
   Call Draw_Meter_s4p( _
      Me _
      ,Me.Label1 _
      ,dbValue _
      ,gColorRed,gColorGold _
      ,Format(dbValue, "0%") _
      ,20,gColorWhite,vbBlack)
   '----- 2
   dbValue = Nz(Me.Value2,0)

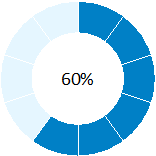
   Call Draw_Meter_s4p( _
      Me _
      ,Me.Label2 _
      ,dbValue _
      ,gColorBluePowder,gColorBlueLight _
      ,Format(dbValue, "0%"))
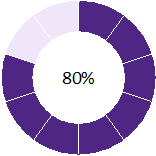
   '----- 3
   dbValue = Nz(Me.Value3,0)

   Call Draw_Meter_s4p( _
      Me _
      ,Me.Label3 _
      ,dbValue _
      ,gColorPurple,gColorPurpleLight _
      ,Format(dbValue, "0%"))
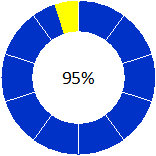
   '----- 4
   dbValue = Nz(Me.Value4,0)

   Call Draw_Meter_s4p( _
      Me _
      ,Me.Label4 _
      ,dbValue _
      ,gColorBlueRoyal,gColorYellow _
      ,Format(dbValue, "0%"))

End Sub
'*************** Code End *****************************************************
Standard Module
'*************** Code Start ***************************************************
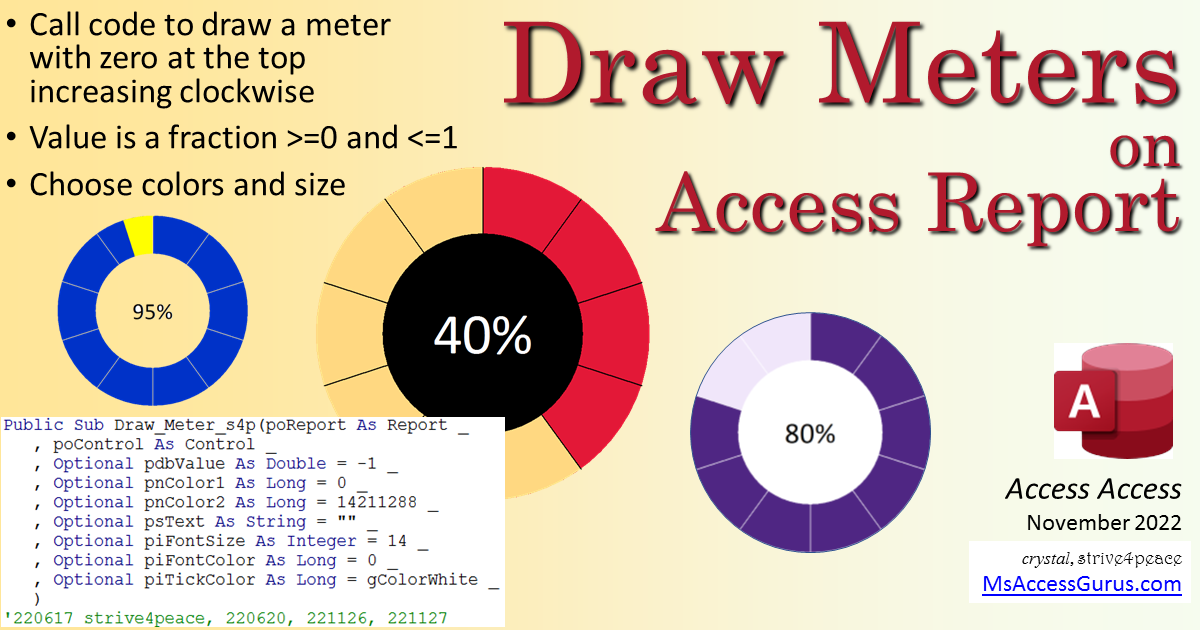
' Purpose  : draw a meter visualizing a value from 0 to 1.00
' Author   : crystal (strive4peace)
' Code List: www.msaccessgurus.com/code.htm
' This code: https://msaccessgurus.com/VBA/Draw_Meters.htm
' LICENSE  :
'   You may freely use and share this code, but not sell it.
'   Keep attribution. Mark your changes. Use at your own risk.
'------------------------------------------------------------------------------
'           Global variables
'------------------------------------------------------------------------------
Public Const InchToTWIP As Integer = 1440  'not used but could be
Public Const PI As Double = 3.14159
Public Const gZero As Single = 0.0000001

Public gXCenter As Single,gYCenter As Single _
      ,gRadius As Single

Public gXLeft As Single,gYTop As Single _
   ,gXWidth As Single,gYHeight As Single

Public gValueDbl As Double

Public Const gColorWhite As Long = 16777215  'RGB(255, 255, 255)

Public Const gColorRed As Long = 3610851  'RGB(227, 24, 55)
Public Const gColorGold As Long = 8509695  'RGB(255, 216, 129)

Public Const gColorBluePowder As Long = 13008896  'RGB(0, 128, 198)
Public Const gColorBlueLight As Long = 16774885  'RGB(229, 246, 255)

Public Const gColorPurple As Long = 8595023  'RGB(79, 38, 131)
Public Const gColorPurpleLight As Long = 16443120  'RGB(240, 230, 250)

Public Const gColorBlueRoyal As Long = 13120000  'RGB(0, 50, 200)
Public Const gColorYellow As Long = 65535  'RGB(255, 255, 0)

'------------------------------------------------------------------------------
'           Draw_Meter_s4p
'------------------------------------------------------------------------------
Public Sub Draw_Meter_s4p(poReport As Report _
   ,poControl As Control _
   ,Optional pdbValue As Double = -1 _
   ,Optional pnColor1 As Long = 0 _
   ,Optional pnColor2 As Long = 14211288 _
   ,Optional psText As String =  "" _
   ,Optional piFontSize As Integer = 14 _
   ,Optional piFontColor As Long = 0 _
   ,Optional piTickColor As Long = gColorWhite _
   )
'220617 strive4peace, 220620, 221126, 221127
'draw a Meter. ZERO at Top
   'PARAMETERS
   '  poReport is the Report object
   '  poControl is a Control object. It will define coordinates
   '(Optional)
   '  pdbValue is fraction using color 1 (percent)
   '           if < 0 then read value from control
   '           To skip reading, send any number >=0
   '  pnColor1 = color that is ON
   '     Default is black
   '  pnColor2 = color that is OFF
   '     Default is light gray.
   '     Make this same as section BackColor if you don't want it to show
   '  psText is text to write in the middle
   '  piFontSize is font size to use for text
   '  piFontColor default is black
   '  piTickColor is color to use for tick marks. Default=white
   'NEEDS
   '  gXCenter
   '  gYCenter
   '  gRadius is radius for the circle (twips)
   'CALLs
   '  ReadScale
   '  SetCenter

   On Error GoTo Proc_Err

   'sgRatio= ratio of inside white circle to circle
   'iTickMarks is the number of tick marks
   'X and Y are for Line tick marks
   'sgAngle is to calculate X and Y
   'iStartEnd is 1 for start angle, 2 for end angle
   'iSet=1 is 1 or 2
   'iMaxSet=1 unless 2 wedges need to be drawn since translating
   'nColorWhite is long for White color

   Dim sgRatio As Single _
      ,sgRadiusMiddle As Single _
      ,x As Single,y As Single _
      ,sgAngle As Single _
      ,i As Integer _
      ,iTickMarks As Integer _
      ,iStartEnd As Integer  ' _
      ,nColorWhite As Long

   'angle 1. start or 2. end
   'Circle can't go past 2 pi
   '  it's starting at pi/2
   '  and changing to be clockwise
   ' angle start,end
   Dim asgAngle(1 To 2) As Single

   'control passed -- get boundaries
   If pdbValue < 0 Then
      'Flag. Negative means read control value
      '0 is a real value that the meter could be
      'read scale and value from control
      Call ReadScale(poControl,True)
      pdbValue = CDbl(gValueDbl)
   Else
      'zero or positive number
      If pdbValue <= 1 Then
         'value is between 0 and 1 -- ok!
      ElseIf pdbValue <= 1.0001 Then
         'close enough to be 1
         pdbValue = 1
      ElseIf pdbValue < 100 Then
         'turn % into fraction if <=100%
         pdbValue = pdbValue / 100
      ElseIf pdbValue <= 100.0001 Then
         pdbValue = 1
      Else
         'value too high
         pdbValue = 1
      End If

      Call ReadScale(poControl,False)
   End If

   Call SetCenter  'set gXCenter, gYCenter, gRadius

   sgRatio = 0.6
   sgRadiusMiddle = sgRatio * gRadius

   iTickMarks = 10

   With poReport

      .ScaleMode = 1  'twips
      .DrawWidth = 1  'pixel

      .FillStyle = 0  'Opaque

      'this is done to keep circle >0 and <=2*pi
      'since angle can't be negative
      If pdbValue < 0.25 Then
         'value in first quadrant
         'draw unslected as background then selected on top
         .FillColor = pnColor2
         poReport.Circle (gXCenter,gYCenter) _
            ,gRadius _
            ,pnColor2

         If pdbValue > 0 Then
            'selected
            asgAngle(1) = PI / 2 - pdbValue * 2 * PI
            asgAngle(2) = PI / 2
            If asgAngle(1) = 0 Then asgAngle(1) = gZero
            .FillColor = pnColor1
            '.Circle Step (x,y), Radius, Color, StartAngle, EndAngle, Aspect
            poReport.Circle (gXCenter,gYCenter) _
               ,gRadius _
               ,pnColor1 _
               ,-asgAngle(1) _
               ,-asgAngle(2)
         End If
      Else
         'draw selected as background then unslected on top
         .FillColor = pnColor1
         poReport.Circle (gXCenter,gYCenter) _
            ,gRadius _
            ,pnColor1
         If (1 - pdbValue) > 0.0001 Then
            'unselected
            asgAngle(1) = PI / 2
            asgAngle(2) = PI / 2 + (1 - pdbValue) * 2 * PI
            If asgAngle(2) = 0 Then asgAngle(2) = gZero
            .FillColor = pnColor2
            '.Circle Step (x,y), Radius, Color, StartAngle, EndAngle, Aspect
            poReport.Circle (gXCenter,gYCenter) _
               ,gRadius _
               ,pnColor2 _
               ,-asgAngle(1) _
               ,-asgAngle(2)
         End If
      End If

      'draw circle in the middle
      'same color as tick marks
      .FillColor = piTickColor
      poReport.Circle (gXCenter,gYCenter) _
         ,sgRadiusMiddle _
         ,piTickColor

      'draw tick marks
      sgAngle = PI / 2
      For i = 0 To iTickMarks - 1
         x = gXCenter + Cos(sgAngle) * gRadius
         y = gYCenter + Sin(sgAngle) * gRadius
         poReport.Line (gXCenter,gYCenter)-(x,y) _
            ,piTickColor
         sgAngle = sgAngle - 2 * PI / iTickMarks
      Next i

      If psText <>  "" Then
         .ForeColor = piFontColor
         .FontSize = piFontSize
         .CurrentX = gXCenter - .TextWidth(psText) / 2
         .CurrentY = gYCenter - .TextHeight(psText) / 2
         .Print psText
      End If

   End With

Proc_Exit:
   On Error GoTo 0
   Exit Sub

Proc_Err:
   Debug.Print  "* Error ",pdbValue
   MsgBox Err.Description _
       ,, "ERROR " & Err.Number _
        &  "   Draw_Meter_s4p"

   Resume Proc_Exit
   Resume

End Sub

'------------------------------------------------------------------------------
'           ReadScale
'------------------------------------------------------------------------------
', Optional pbGetValue As Boolean = True)
Public Sub ReadScale(oControl As Control _
   ,Optional pReadValue As Boolean = False)

'220618 s4p
'read control Scale, set global variables
'first step
   With oControl
      gXLeft = .Left
      gYTop = .Top
      gXWidth = .Width
      gYHeight = .Height

      If pReadValue <> False Then
         On Error Resume Next  'skip error if value can't be read
         gValueDbl = Nz(.Value,0)
      End If
   End With
   On Error GoTo 0
End Sub

'------------------------------------------------------------------------------
'           SetCenter
'------------------------------------------------------------------------------
Public Sub SetCenter( _
   Optional piQtyX As Integer = 1 _
   ,Optional piQtyY As Integer = 1 _
   )
'220618 strive4peace
'calculate gXCenter, gYCenter, gRadius
'  from global variables
'optionally, send number of objects if not 1
'  such as Stoplight has piQtyY=3

   gXCenter = gXLeft + gXWidth / 2
   gYCenter = gYTop + gYHeight / 2

   If gXWidth / piQtyX < gYHeight / piQtyY Then
      gRadius = gXWidth / piQtyX / 2
   Else
      gRadius = gYHeight / piQtyY / 2
   End If
End Sub
'*************** Code End *****************************************************
' Code was generated with colors using the free
Color Code add-in for Access.
