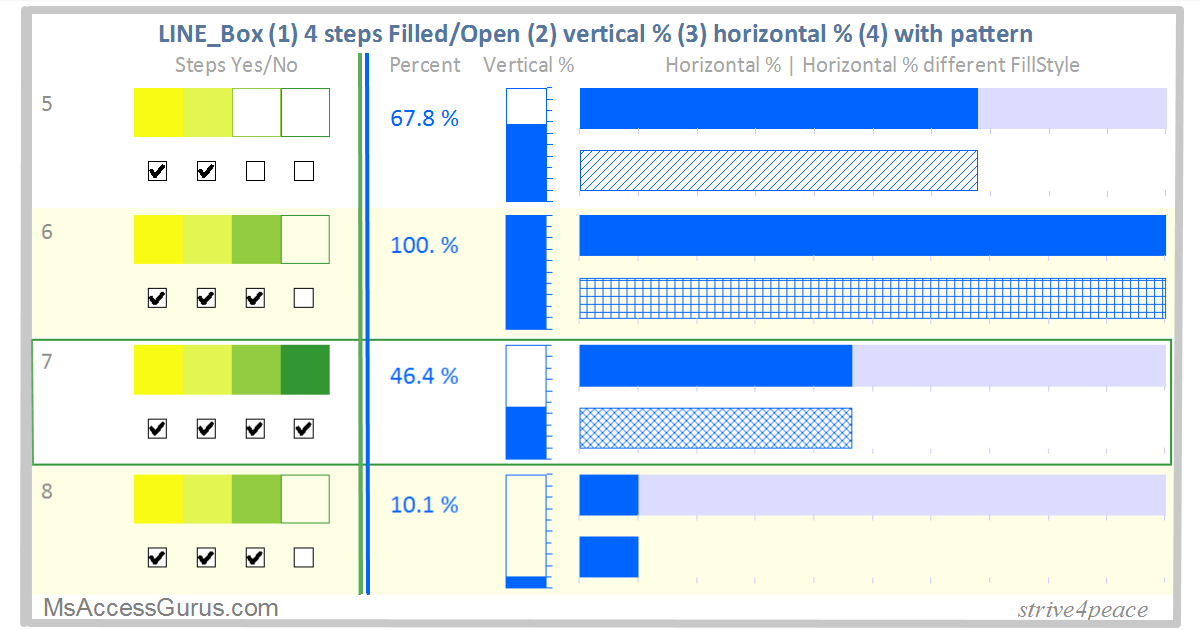
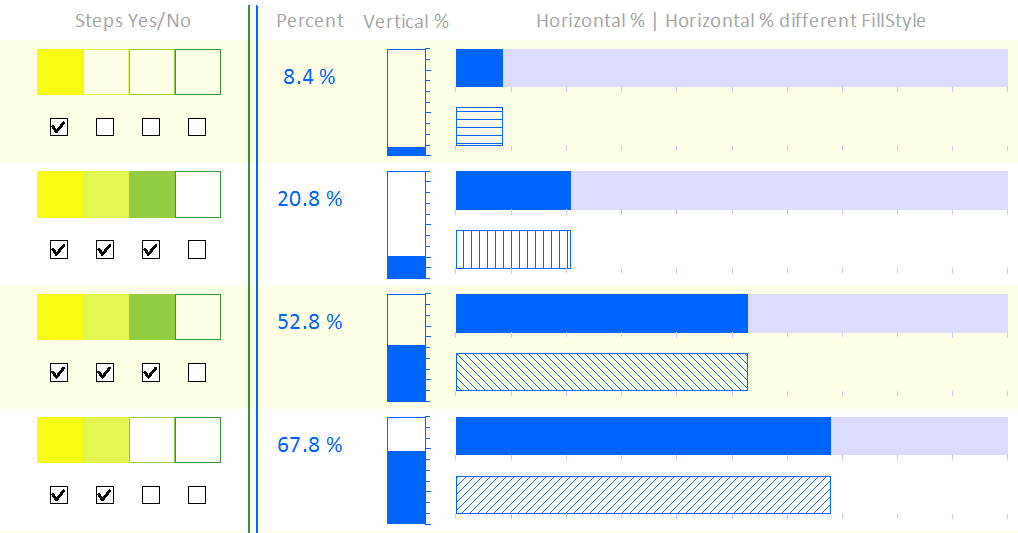
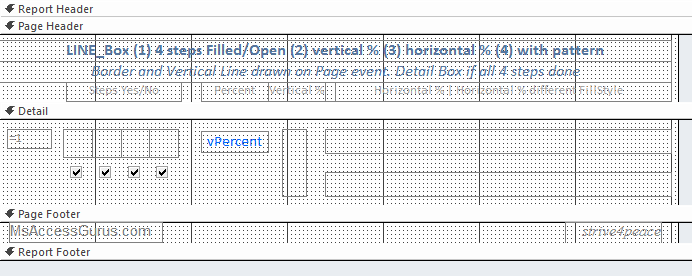
Since colors are used on every record,
their Long Integer RGB values are defined
in the ReportHeader_Format event.
Open and Filled Boxes use these colors on each record
in the Detail_Format event.
Option Compare Database
Option Explicit
' Draw Lines and Boxes on reports
'*************** Code Start *****************************************************
' code behind report: r_LINE_Box
'(1-4) Filled/Open
'(5) vertical % (6) horizontal % (7) horizontal % pattern
' Report Draw Reference:
'  https://msaccessgurus.com/VBA/ReportDraw_Reference.htm
' VBA and download this database:
'  https://msaccessgurus.com/VBA/Draw_Line_Box.htm
'-------------------------------------------------------------------------------
' Purpose  : draw using the Line method
'            page border and lines in Page event
'            Examples for data in Detail
'            detail border if condition is true
' Author   : crystal (strive4peace)
' Code List: www.msaccessgurus.com/code.htm
'-------------------------------------------------------------------------------
' LICENSE
'   You may freely use and share this code, but not sell it.
'   Keep attribution. Use at your own risk.
'-------------------------------------------------------------------------------
'-------------------------------------------------------------------------------
'           Module variables for Color
'-------------------------------------------------------------------------------
Private Const mnColorBLUE As Long = 16737280 _
   ,mnColorBlack As Long = 0

Private mnColorStep(1 To 4) As Long

'-------------------------------------------------------------------------------
'           ReportHeader_Format
'-------------------------------------------------------------------------------
Private Sub ReportHeader_Format(Cancel As Integer,FormatCount As Integer)
   'define colors
   mnColorStep(1) = RGB(248,252,20)  'yellow-green     '
   mnColorStep(2) = RGB(226,245,81)  'green-yellow
   mnColorStep(3) = RGB(146,204,65)  'medium green
   mnColorStep(4) = RGB(50,150,50)   'dark green
End Sub
Goto Top
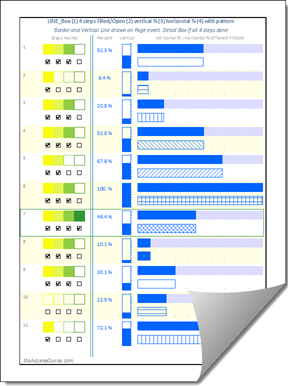
'-------------------------------------------------------------------------------
'           Report_Page
'-------------------------------------------------------------------------------
Private Sub Report_Page()
'220802, ...05
   Call DrawBorder(Me _
         ,4 _
         ,RGB(200,200,200) _
         ,30)
   '1440 twips per inch
   With Me
      Call DrawVerticalLine(Me _
         ,(2.05 * InchToTWIP) _
         ,4 _
         ,mnColorStep(4) _
         ,.LabelHeading_Steps.Top _
         ,.PageFooterSection.Height)

      Call DrawVerticalLine(Me _
         ,(2.1 * InchToTWIP) _
         ,4 _
         ,mnColorBLUE _
         ,.LabelHeading_Steps.Top _
         ,.PageFooterSection.Height)
   End With
End Sub
Goto Top
'-------------------------------------------------------------------------------
'           Detail_Format
'-------------------------------------------------------------------------------
Private Sub Detail_Format( _
   Cancel As Integer _
   ,FormatCount As Integer _
   )
'draw with LINE
' use (Label) controls for boundaries
'220802,... 05 strive4peace2

   Dim x1 As Single,y1 As Single _
      ,x2 As Single,y2 As Single _
      ,x As Single _
      ,y As Single _
      ,sgPercent As Single

   Dim sControlname As String _
      ,i As Integer

   With Me
      '-----------  set up drawing space
      .ScaleMode = 1  'twips, default
      .DrawWidth = 1  'pixel
Goto Top
      ' ~~~~~~~~~~~~~~~~~~~~~~~~~~~~~~~~ FilledOpen YesNo Steps
      '----------- Label_YesNo1,2,3,4 and vYesNo1,2,3,4
      For i = 1 To 4

         'control for size and position
         sControlname =  "Label_YesNo" & Format(i, "0")
         With .Controls(sControlname)
            'get control coordinates for size of box
            x1 = .Left
            y1 = .Top
            x2 = .Left + .Width
            y2 = .Top + .Height
         End With

         'control with value
         sControlname =  "vYesNo" & Format(i, "0")

         'draw filled box if True, open box if False
         If .Controls(sControlname) <> 0 Then  'True
            .FillStyle = 0  'opaque
            .FillColor = mnColorStep(i)
         Else  'False
            .FillStyle = 1  'transparent
         End If

         '----- draw a box
         Me.Line (x1,y1)-(x2,y2),mnColorStep(i),B
      Next i
Goto Top
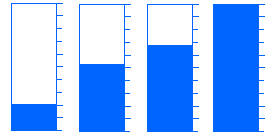
      '================================================ Percent
      sgPercent = Nz(.vPercent,0)

      ' ~~~~~~~~~~~~~~~~~~~~~~~~~~~~~~~~ Label_Vertical

      '----------- Label_Vertical
      'vertical column percent

      With .Label_Vertical

         x1 = .Left
         y1 = .Top

         x2 = .Left + .Width
         y2 = .Top + .Height
         y = y1 + (y2 - y1) * (1 - sgPercent)    '(.Height * (1 - sgPercent))
      End With

      If sgPercent > 0 Then
         .FillStyle = 0  'opaque
         '----- draw filled box
         Me.Line (x1,y)-(x2,y2),mnColorBLUE,BF
      End If

      .FillStyle = 1  'transparent

      '----- draw open box around everything
      Me.Line (x1,y1)-(x2,y2),mnColorBLUE,B

      '----- draw tick marks every 10
      x1 = x2
      x2 = x1 + 50  'tick width should be calculated

      .DrawWidth = 1

      For i = 0 To 10
         y = y1 + i * (y2 - y1) / 10
         Me.Line (x1,y)-(x2,y),mnColorBLUE
      Next i
Goto Top

      ' ~~~~~~~~~~~~~~~~~~~~~~~~~~~~~~~~ Label_Horizontal
      '----------- Label_Horizontal
      'horizontal bar
      'empty color solid first

      With .Label_Horizontal
         x1 = .Left
         x2 = .Left + .Width
         y1 = .Top
         y2 = .Top + .Height
         x = x1 + (x2 - x1) * sgPercent
      End With

      .FillStyle = 0  'opaque
      '----- draw light blue filled box behind everything
      Me.Line (x1,y1)-(x2,y2),RGB(220,220,255),BF

      If sgPercent > 0 Then
         '----- draw filled box for value
         Me.Line (x1,y1)-(x,y2),mnColorBLUE,BF
      End If

      '----- draw tick marks every 10 under bar chart
      y1 = y2
      y2 = y1 + 50  'tick length should be calculated

      .DrawWidth = 1

      For i = 0 To 10
         x = x1 + i * (x2 - x1) / 10
         If i = 10 Then x = x - 10  'adjust for DrawWidth

         Me.Line (x,y1)-(x,y2),RGB(200,200,255)
      Next i
Goto Top

      ' ~~~~~~~~~~~~~~~~~~~~~~~~~~~~~~~~ Label_HorizontalPattern
      '----------- Label_HorizontalPattern
      'horizontal bar
      'pattern

      With .Label_HorizontalPattern
         x1 = .Left
         x2 = .Left + .Width
         y1 = .Top
         y2 = .Top + .Height
         x = x1 + (x2 - x1) * sgPercent
      End With

      .FillStyle = .Num Mod 8   '0=opaque to 7
      .FillColor = mnColorBLUE

      If sgPercent > 0 Then
         '----- draw box for value
         Me.Line (x1,y1)-(x,y2),mnColorBLUE,B
      End If

      '----- draw tick marks every 10 under bar chart
      y1 = y2
      y2 = y1 + 50  'tick length should be calculated

      .DrawWidth = 1

      For i = 0 To 10
         x = x1 + i * (x2 - x1) / 10
         If i = 10 Then x = x - 10  'adjust for DrawWidth

         Me.Line (x,y1)-(x,y2),RGB(200,200,255)
      Next i
Goto Top

      '================================================ Border Box
      ' draw box around detail section if all checkboxes are true
      ' currently this is vYesNo4 -- last one in the loop
      If .Controls(sControlname) <> 0 Then  'all True
         'box around detail. 4px= Line width, 80 twip margins
        Call DrawBorder(Me,4,mnColorStep(4),80)
      End If

      ' ~~~~~~~~~~~~~~~~~~~~~~~~~~~~~~~~~~~~~~~~~~~~~~~~~~

   End With  'Me
End Sub
'*************** Code End *******************************************************
Goto Top
Standard Module: mod_Draw_Border_Lines
Option Compare Database
Option Explicit

'*************** Code Start *****************************************************
' module: mod_Draw_Border_Lines
' Reference for drawing on reports:
'  https://msaccessgurus.com/VBA/ReportDraw_Reference.htm
' VBA and download with this example:
'  https://msaccessgurus.com/VBA/Draw_Line_Box.htm
'-------------------------------------------------------------------------------
' Purpose  : draw a border or lines on a report.
'               if called on page event, draw on page
'               if called in section, draw in section
' Author   : crystal (strive4peace)
' Code List: www.msaccessgurus.com/code.htm
'-------------------------------------------------------------------------------
' LICENSE
'   You may freely use and share this code, but not sell it.
'   Keep attribution. Use at your own risk.
'-------------------------------------------------------------------------------
'           Public
'-------------------------------------------------------------------------------
Public Const InchToTWIP As Single = 1440

'-------------------------------------------------------------------------------
'           DrawBorder
'-------------------------------------------------------------------------------
Public Sub DrawBorder(poReport As Report _
   ,Optional piDrawWidth As Integer = 2 _
   ,Optional pnColor As Long = 0 _
   ,Optional pTwipMargin As Single = 40 _
   )
'220801 strive4peace
   'CALL from Report Page event
   '     or conditionally from section event
   '  1440 * 0.25 = 360

   'PARAMETERS
   '  poReport is the report object
   '  piDrawWidth is the line width in pixels
   '  pnColor is the line color
   '  pTwipMargin is the same margin for each dimension

   Dim x1 As Single,y1 As Single _
      ,x2 As Single,y2 As Single

   With poReport  'Report

      '-----------  set up drawing space
      .ScaleMode = 1  'twips, default
      .DrawWidth = piDrawWidth  'line width
      .FillStyle = 1  'transparent

      x1 = .ScaleLeft + pTwipMargin
      y1 = .ScaleTop + pTwipMargin
      x2 = .ScaleLeft + .ScaleWidth - pTwipMargin
      y2 = .ScaleTop + .ScaleHeight - pTwipMargin

   End With  'report

   'draw a box
   poReport.Line (x1,y1)-(x2,y2),pnColor,B

End Sub

'-------------------------------------------------------------------------------
'           DrawVerticalLine
'-------------------------------------------------------------------------------
Public Sub DrawVerticalLine(poReport As Report _
   ,pX As Single _
   ,Optional piDrawWidth As Integer = 1 _
   ,Optional pnColor As Long = 0 _
   ,Optional pYtopTwip As Single = 720 _
   ,Optional pYbottomTwip As Single = 360 _
   )
'220801 strive4peace
   'usually CALL from Report Page event
   'RGB(150, 150, 150) = 9868950
   'defaults: 1440/2=720 top margin 1/2", bottom 1/4"

   Dim y1 As Single,y2 As Single

   With poReport  'Report

      '-----------  set up drawing space
      .ScaleMode = 1  'twips, default
      .DrawWidth = piDrawWidth
      .FillStyle = 1  'transparent

      y1 = .ScaleTop + pYtopTwip
      y2 = .ScaleTop + .ScaleHeight - pYbottomTwip
   End With  'report

   'draw a line
   poReport.Line (pX,y1)-(pX,y2),pnColor

End Sub
'*************** Code End *******************************************************
' Code was generated with colors using the free


